Difference between revisions of "IS428 2016-17 Term1 Assign3 Chua Feng Ru"
| Line 28: | Line 28: | ||
===Employee Data=== | ===Employee Data=== | ||
| − | For the employee data, there is a need to generate the proximity id without the numeric number (e.g., | + | For the employee data, there is a need to generate the proximity id without the numeric number (e.g., Mat Bramar -> mbramar). JMP formula is used to achieve this. |
| + | |||
| + | [[File:ChuaFengRu_MA3_DCT_6.JPG|500px|thumb|center]] | ||
==Data Findings and Analysis== | ==Data Findings and Analysis== | ||
Revision as of 04:43, 24 October 2016
Contents
Problem & Motivation
While the new office is built to the highest energy efficiency standard, the problem is that there are still several HVAC issues to work out. And thus, the motivation is to use visual analytics to find out what are the most probable issues within the new building.
Data Cleaning and Transformation
Building Data
As for the initial building data, the data is structured such that each record or row has multiple columns as the data elements. The first step is to use JMP Pro to structure the data in the format of (Date/Time, Floor, Zone, Building Data Attribute, Value).
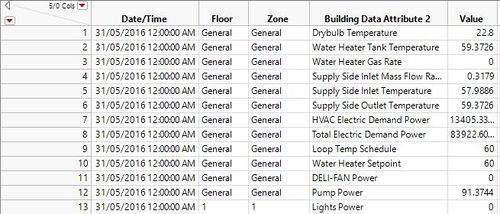
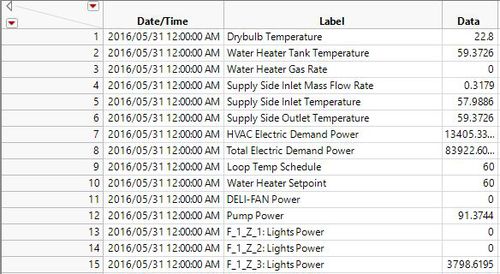
The process in transforming the data, is to first use the "Stack" feature of JMP Pro. This will allow me to format the data as below:
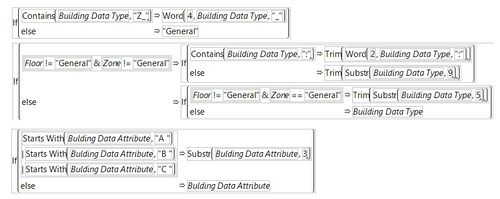
However, I realised that certain fields still contain Floor and Zone information. Thus, I used a series of formulas to separate the Floor and Zone information from the label. The following are the formulas which are used to accomplish the data cleaning process.
Hazium Concentration Data
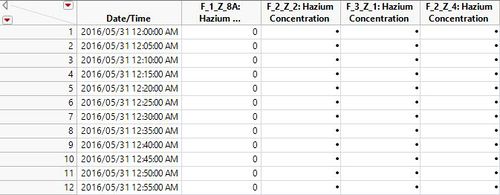
For the Hazium Concentration Data, I realised that there are the files are splitted according to the sensors in each zone or floor. The first thing to do is to join the files together into 1 single table, with JMP Pro's "Concatenate" table function.
After that is done, I will have multiple columns of Hazium readings, I perform similar function of using the "Stack" feature to restructure the data. And formulas is also used to split the get the relevant zones and floor information. And the end product is as of below:
Employee Data
For the employee data, there is a need to generate the proximity id without the numeric number (e.g., Mat Bramar -> mbramar). JMP formula is used to achieve this.
Data Findings and Analysis
Q1: Typical Day for GasTech Employees
- Typical Day for GasTech Employees
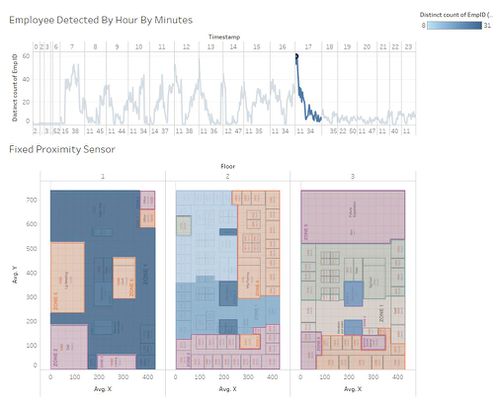
Typically,GasTech employees will report to the office at 7AM, and next at 12PM they will go for an hour lunch, and finally end work at 5PM.
Q2: Interesting Pattern in Data
| No. | Interesting Pattern | Possible Significance |
|---|---|---|
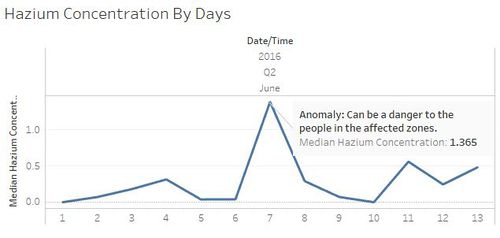
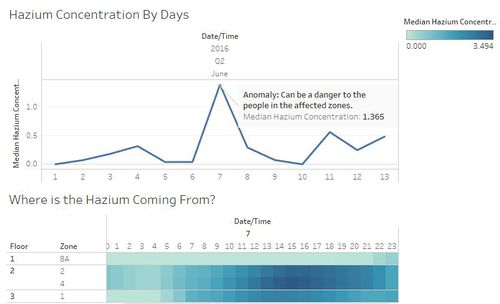
| 1 | The spike in hazium concentration can potentially cause harm to the occupants within the zone. | |
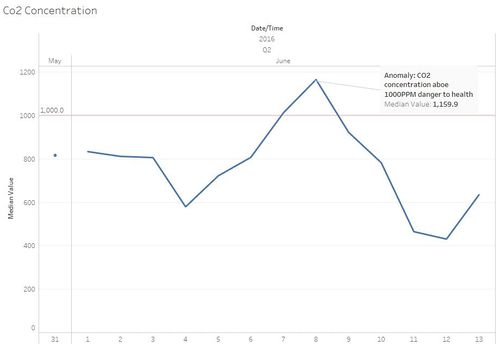
| 2 | This can potentially cause danger to the people in the affected area at > 1000PPM. | |
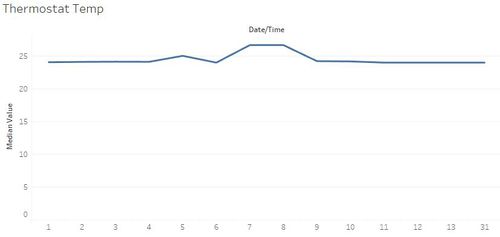
| 3 | This is not considered to be dangerous, however it is interesting to note that out of the entire 2 weeks, the data is highest at this 2 points. And can serve as a basis to find out if the something is not functioning well in the HVAC system to bring down the temperature. | |
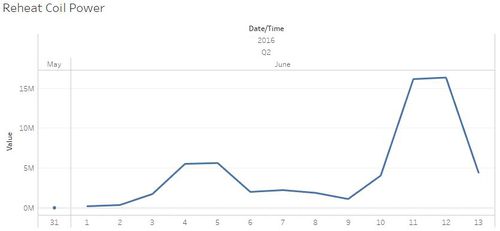
| 4 | This can serve as point of investigation regarding the efficiency of the HVAC system, as there seems to be a sudden heating process going on. This may or may not be due to a faulty sensor. | |
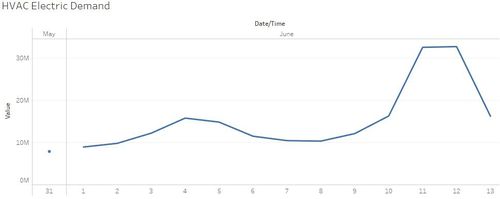
| 5 | The sudden spike in HVAC electric demand can also serve as a point of initial investigation as there may be some parts of the HVAC components not working as expected. | |
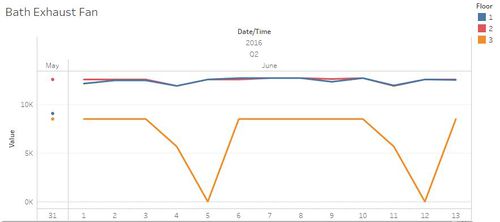
| 6 | The interesting finding is that the Bath Exhaust Fan power is in constant usage for Floor 1 and 2, while Floor 3 has zero power consumption. This serve as a point to investigate power efficiency of the Bath Exhaust System. | |
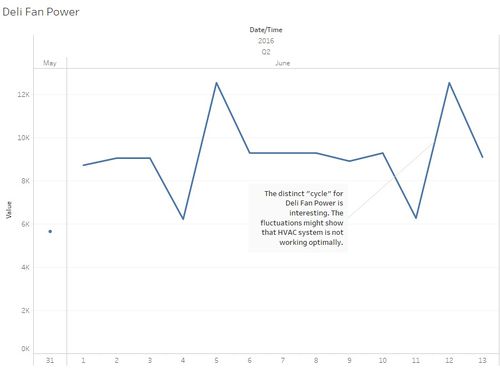
| 7 | It is interesting that the pattern showed that there is a distinct cycle in terms of the power usage. It may be interesting to find out what is causing these "cycle". | |
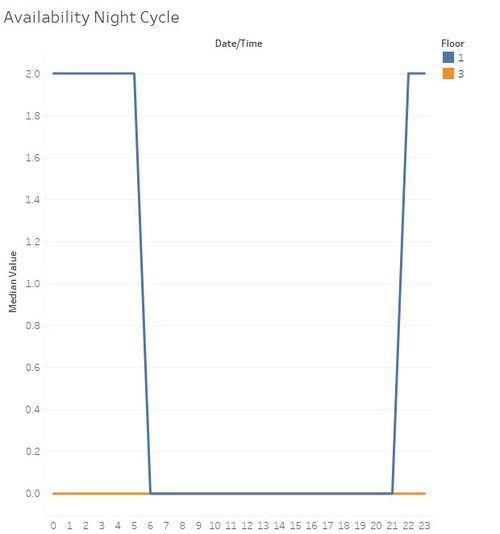
| 8 | It seems that only Floor 1 Night Cycle Manager is working properly, and that the Floor 3 Night Cycle Manager seems not be working at all. |
Q3: Anomalies in Data
| No. | Anomaly | Description | Importance |
|---|---|---|---|
| 1 | The Hazium concentration is harmful to the occupants of relevant areas, and the findings reveal that there is Floor 2 (Zones 2 and 4) is has the highest amount of Hazium concentration from 2PM to 5PM. | High (Health Damaging) | |
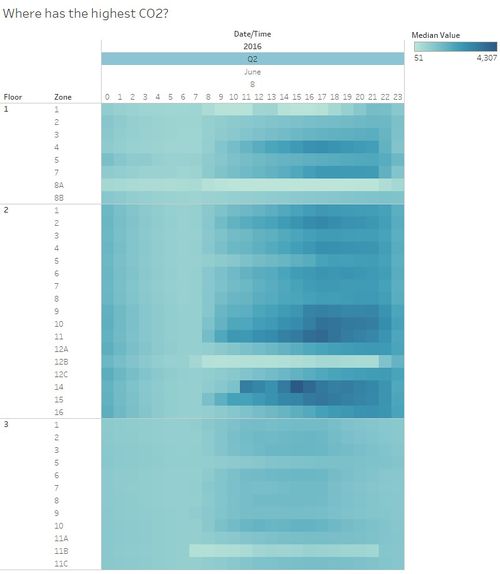
| 2 | The findings showed that CO2 concentration is the highest in the afternoon period in Floor 1 and 2, however Floor 3 seems to reflect that there is a low CO2 concentration in general. | High (Health Damaging) | |
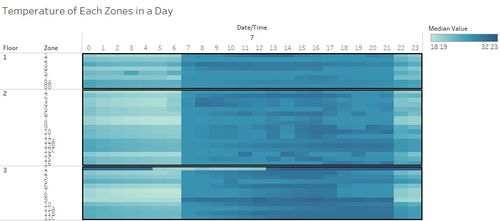
| 3 | While the temperature is higher from 7am to 9 pm, it is interesting to note that Floor 3 Zone 1 has a high temperature of more than 30 degrees celsius for the entire day, except for 5AM to 1PM | High (Serious issue for building operations, as HVAC not working well in some areas). | |
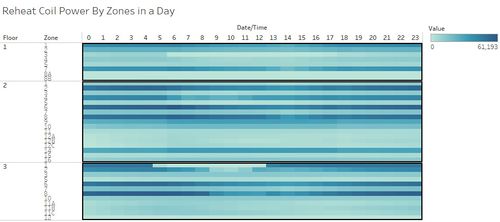
| 4 | It is interesting to note that while temperature is generally higher from 7am to 9pm for most areas, the Reheat Coil Power in some zones in Floor 2 is still very much using a significant amount of power. This might be the cause of high temperature in previous finding. | High (Serious issue for building operations, as HVAC not working well in some areas). |
