Difference between revisions of "TheBigScreen"
| Line 48: | Line 48: | ||
==Related Work== | ==Related Work== | ||
| − | {| class="wikitable" width="100%" | + | {| class="wikitable" style="background-color:#FFFFFF;" width="100%" |
|- | |- | ||
! style="width: 50%;" | Visualizations | ! style="width: 50%;" | Visualizations | ||
Revision as of 16:14, 4 October 2016
| Proposal | Project Presentation | Poster | Application | Research Paper |
Contents
Problem and Motivation
Is it possible to predict how good a movie will be before it even screens? This is a subjective question. While some rely on movie critics and early reviews, others depend on instinct. However, we know reviews can take a long time to gather and human instinct is simply unreliable. Thousands of movies are produced every year and all of them our clamouring for the $11 we spend on movie tickets! Our group wants to know if we can predict which movies are worth you spending your money and time on.
Data
We are using the IMDB 5000 Movie Dataset from Kaggle. The Internet Movie Database (IMDB) is an online database of information related to films, television programs and video games [1]. Amongst its functions, IMDB allows users rate movies on a scale of 1 to 10.
The dataset contains the following variables, including but not limited to:
- movie title
- director name
- actors’ names and Facebook likes
- length of movie
- year
- gross earnings
- genres
- language
- country
- content rating
- budget
- IMDB rating
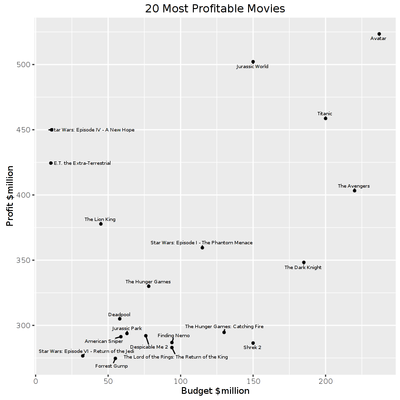
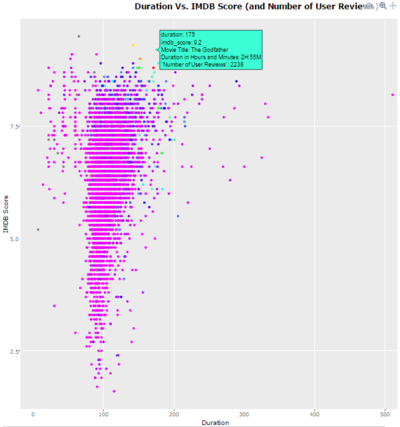
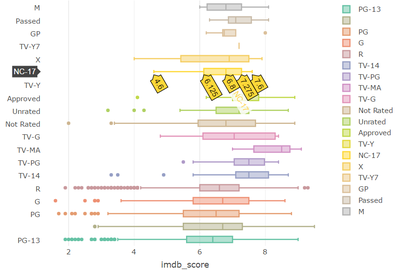
Related Work
| Visualizations | Learning Points |
|---|---|
|
|
|
| |
|


