Difference between revisions of "IS428 2016-17 Term1 Assign2 Manas Mohapatra"
Manasm.2012 (talk | contribs) |
Manasm.2012 (talk | contribs) |
||
| (One intermediate revision by the same user not shown) | |||
| Line 27: | Line 27: | ||
[[File:manas3.png|800px|frameless|center]] | [[File:manas3.png|800px|frameless|center]] | ||
| − | But this needs further analysis. Industry needs to be broken down into SSIC codes, and when we move deeper into the industry analysis, we find that Under Construction: | + | But this needs further analysis. Industry needs to be broken down into SSIC codes, and when we move deeper into the industry analysis, we find that Under Construction: the SSIC code 410 has the highest width. This corresponds to "Construction of buildings", which is thus more dangerous for workers, given a relatively higher rate of injuries. |
[[File:manas4.png|800px|frameless|center]] | [[File:manas4.png|800px|frameless|center]] | ||
Another interesting point to analyse is to see if Negligence was a factor in injuries. Negligence is measured by how much overtime work did a victim do, whether the injuries happened during unofficial work. Negligence can also be measured on the part of the employer by letting an unexperienced worker do the work. This could be calcluated by subtracting the starting date work from the accident date. These 3 factors could be grouped to see any potential reasons for injuries due to negligence. As we see below, Negligence is not a significant parameter in determining injuries. | Another interesting point to analyse is to see if Negligence was a factor in injuries. Negligence is measured by how much overtime work did a victim do, whether the injuries happened during unofficial work. Negligence can also be measured on the part of the employer by letting an unexperienced worker do the work. This could be calcluated by subtracting the starting date work from the accident date. These 3 factors could be grouped to see any potential reasons for injuries due to negligence. As we see below, Negligence is not a significant parameter in determining injuries. | ||
[[File:manas5.png|800px|frameless|center]] | [[File:manas5.png|800px|frameless|center]] | ||
| − | |||
Even though the 3 variables dedicated to negligence weren't significant, there are other ways negligence variable can be enriched. One way could have been by analysing the variable: "supposed start work timing on day injured. This variable could have captured the cause on a more minute level, that's its possible worker was injured on that particular day because of exhaustion. But this vairable by itself is useless, since we need reference line for each organization and task to capture the exhaustion factor . Note: we can't assume that if the work starts early in the morning, then it implies long working hours, since many jobs require unconventional starting time, such as MRT construction and/or repairs. THis can also be noticed in the other instanced of this variable, where the work sometimes start at midnight. | Even though the 3 variables dedicated to negligence weren't significant, there are other ways negligence variable can be enriched. One way could have been by analysing the variable: "supposed start work timing on day injured. This variable could have captured the cause on a more minute level, that's its possible worker was injured on that particular day because of exhaustion. But this vairable by itself is useless, since we need reference line for each organization and task to capture the exhaustion factor . Note: we can't assume that if the work starts early in the morning, then it implies long working hours, since many jobs require unconventional starting time, such as MRT construction and/or repairs. THis can also be noticed in the other instanced of this variable, where the work sometimes start at midnight. | ||
| Line 37: | Line 36: | ||
But another interesting dimension can be added to negligence i.e. No. of Employees under Informant. This shifts the negligence from the worker to the informer. I.e. it's possible that the informer had too many employees under him/her to handle, which is why the injury could possibly have occured. And as we see, the corelation between these 2 factors is significant. | But another interesting dimension can be added to negligence i.e. No. of Employees under Informant. This shifts the negligence from the worker to the informer. I.e. it's possible that the informer had too many employees under him/her to handle, which is why the injury could possibly have occured. And as we see, the corelation between these 2 factors is significant. | ||
[[File:manas7.png|800px|frameless|center]] | [[File:manas7.png|800px|frameless|center]] | ||
| − | |||
| − | |||
| − | |||
| − | |||
| − | |||
Latest revision as of 11:57, 26 September 2016
Background
Bigger the data, the more robust is the conclusion. This is the general rule of thumb used by data analysts. This is where the term Big Data comes from as well. But, it’s not so straightforward, as there are several aspects to it. If the dataset has more Rows, it usually strengthens the hypothesis, makes the conclusion more robust. But if it has more Columns or variables, then the result is often more confusing, as it becomes increasingly more difficult to deal with the dataset. The dataset of Work Place Injuries deals with nearly 50 variables. Upon a first glance, I decided to investigate the major causes of work place injuries based on the variables given such as Type of work, Industry etc. But such datasets needs to be approached with a systematic procedure, as follows.
Research and Data Preparation
The first step in the process is to check out all the variables and get a sense of secondary research that needs to be done. Research could include things like industry standards/benchmarks. For instance, why did the variables decided to segregate “percentage of manual labour” into 2 halves: >50% and <=50% manual work.
Next part comes data cleaning. A closer inspection shows you that there are many redundant variables such as Year (There’s nothing significant gained from this variable as all the data is collected in 2014). Oftentimes the same variable is mentioned as a string and number such as the first day of the week is referred to as “Monday” under Weekday and 1 under Weekday no. This is obviously repetition of variables. Of these I decided to keep the former Variable so that it’s automatically interpreted as a string and hence a categorical variable in JMP and Tableau.
The next step is to clean out anonymized variables. But before completely deleting them, I deemed it necessary to observe their distribution to notice any unusual patterns. I was about to clean the dataset from other unnecessary variables such as names and Ids because they are obviously anonymized. Thus variables such as informant name, organization name, Organization SSIC codes needed to be deleted off the data set. But this is where the secondary research helped me. Upon a closer inspection, SSIC is not anonymized, rather it’s a code set by the government to identify the industry a company is in. There are several kinds of SSIC codes, but the ones used in these datasets are based on year 2010, which consist of a 2 digit code in the first level, 3 digit in the second level, all the way upto a complete 5 digit code. This will be discussed further in the analysis.
The final step to data understanding and preparation was to classify the data. This helps to neatly arrange the data to have a better understanding, it helps in forming hypothesis, it helps in observing potential cause and effect relationships. Below’s a snapshot from the data classification. The variables in yellow, green and red indicate variables to clean out, to inspect before deleting, to analyze respectively:
I had to classify and reclassify the above based on gaining a deeper understanding of the dataset. For instance before researching SSIC, I had organized the SSIC variables under “Reporting”, but after understanding it I decided to reclassify it under type of work. As SSIC Codes works together with industry and sub-industry variables to define the type of work the victim is in. Some other data preparation included assigning categorical type to variables such as weekday no., codes, accident types which were otherwise automatically assigned a numeric status
Data Analysis
I made a rough flow chart to form hypothesis:
RELEVANT CONTEXT --> KNOWN CAUSE (+ Hidden Correlations) --> INJURY --> REPORTING
The relevant context is the Type of Work the victim was working in. The known cause is the obvious causes mentioned that leads to injury. But I step in to provide insights into hidden correlation which could also be leading to injuries. These correlations could form up within the known causes, or could work alongside the “relevant context”. I decided to not focus on reporting, as there wasn’t any interesting insight into reporting matters. Note: I mention correlation, since correlation can’t be equated to causation. All these tools can only point out any correlation. To verify a correlation into causation, experimentation is often a necessity Now there are multiple variables in this dataset, thus the very obvious analysis tool one should be using is the Multivariate analysis. But, there’s one issue with it. Multivariate analysis works much well for continuous data, while in our case: the dataset contains nearly 90% categorical data. Thus most of my analysis is bivariate in nature, with Mosaic Plots as the predominant tool. Every once in a while, I used a Logistic fit to understand any correlation between categorical and continuous variable. Unfortunately, none of my hypothesis required any analysis between continuous variables only. The following are my hypothesis and results:
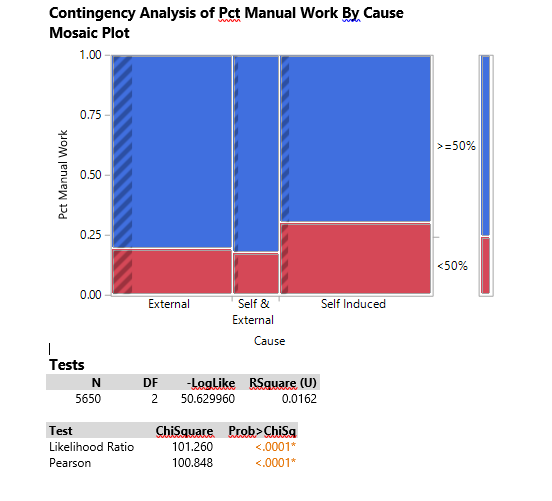
Percentage of Manual Work By Cause There is significant corelation between percentage of manual work done and cause. Whilst this is true, the same couldn't be said regarding percentage of manual work and injury indicator (i.e. Major or Minor injuries)
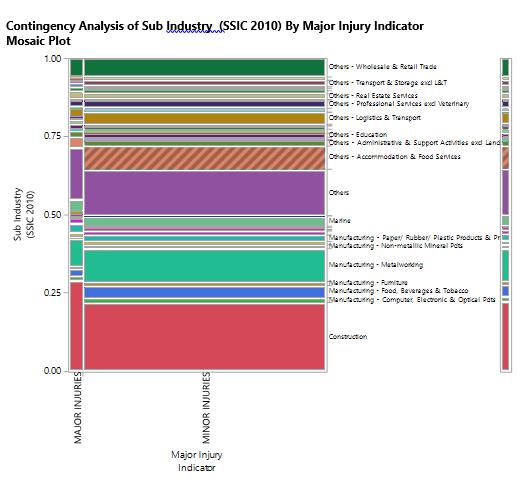
When analysed based on industry, Construction seems to be the major industry with a significant chunk of injuries. The rest 2: Manufacturing and Others are quite fragmented.
But this needs further analysis. Industry needs to be broken down into SSIC codes, and when we move deeper into the industry analysis, we find that Under Construction: the SSIC code 410 has the highest width. This corresponds to "Construction of buildings", which is thus more dangerous for workers, given a relatively higher rate of injuries.
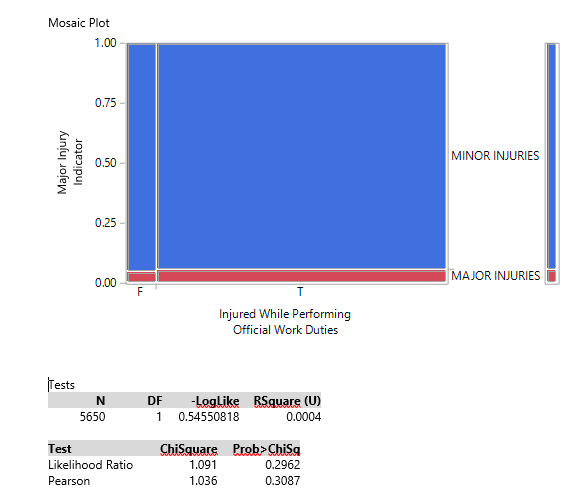
Another interesting point to analyse is to see if Negligence was a factor in injuries. Negligence is measured by how much overtime work did a victim do, whether the injuries happened during unofficial work. Negligence can also be measured on the part of the employer by letting an unexperienced worker do the work. This could be calcluated by subtracting the starting date work from the accident date. These 3 factors could be grouped to see any potential reasons for injuries due to negligence. As we see below, Negligence is not a significant parameter in determining injuries.
Even though the 3 variables dedicated to negligence weren't significant, there are other ways negligence variable can be enriched. One way could have been by analysing the variable: "supposed start work timing on day injured. This variable could have captured the cause on a more minute level, that's its possible worker was injured on that particular day because of exhaustion. But this vairable by itself is useless, since we need reference line for each organization and task to capture the exhaustion factor . Note: we can't assume that if the work starts early in the morning, then it implies long working hours, since many jobs require unconventional starting time, such as MRT construction and/or repairs. THis can also be noticed in the other instanced of this variable, where the work sometimes start at midnight.
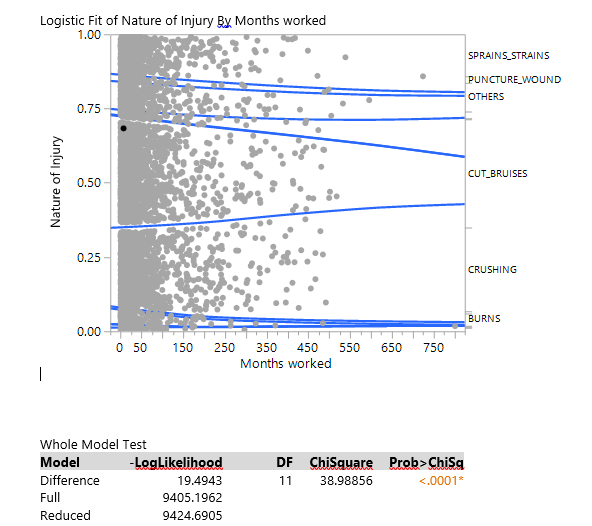
But another interesting dimension can be added to negligence i.e. No. of Employees under Informant. This shifts the negligence from the worker to the informer. I.e. it's possible that the informer had too many employees under him/her to handle, which is why the injury could possibly have occured. And as we see, the corelation between these 2 factors is significant.


