Difference between revisions of "IS428 2016-17 Term1 Assign2 Albert Bingei"
Albertb.2013 (talk | contribs) |
Albertb.2013 (talk | contribs) |
||
| (One intermediate revision by the same user not shown) | |||
| Line 52: | Line 52: | ||
==Analysis== | ==Analysis== | ||
| − | + | [[File:GTOT.png]] | |
First we analyze the distribution of the tool usage frequency. This is done by creating a dashboard of all the histograms of the total tools used for each of the TOT variable columns created earlier. | First we analyze the distribution of the tool usage frequency. This is done by creating a dashboard of all the histograms of the total tools used for each of the TOT variable columns created earlier. | ||
| Line 64: | Line 64: | ||
* 0 to 2 tools for assessment | * 0 to 2 tools for assessment | ||
| − | + | [[File:G role puby.png]] | |
| − | |||
| − | |||
| + | From the treemap, we observe that as the years pass by, PhD students are the ones that are utilizing more tools and publishing their papers, exceeding that of Professors/Associate professors and Assistant professor roles. | ||
==Tools Utilized== | ==Tools Utilized== | ||
Latest revision as of 10:52, 26 September 2016
Abstract
This article attempts to explore the innovations in scholarly communication. Scholarly communication is essentially the process by which academics, scholars and researchers share and publish their research findings for the academic community and general public. A survey was administered to over 20,000 academics, scholars and researchers to discover which sites or tools are being used the most to achieve their different academic functions.
Problem and Motivation
We explore the dataset and attempt to answer the following questions
- does using 1 tool mean loyal to that tool?
- Are there tools that are more strongly preferred for each stage
- What is the most popular flow? Is the most popular flow individually the most popular flow joined?
- Who are those who use the most tools like? The fewest tools like?
- Relationship between number of tools used and support for
- Any complementary tools? Users who use x tend to use y
- Does using google scholar tend to use other tool
- Distribution by country
- By discipline
- Which tool is most popular in which year
- Would using a particular tool influence goals of open access open science
Procedure
For Data cleaning, Excel 2016 is used. The following steps are taken:
1) Recoding all the categorical variable responses from null and filled to 0 and 1
Example: For all the 8 options of the question: What discipline(s) are you working in? Each option is coded 0 or 1 in separate columns instead of null and Physical Sciences if the respondent selected Physical Sciences.
Acknowledge that the above steps can be done on Tableau using calculated field but being a large dataset, the time taken to load after each calculated field created is much longer to input each calculated field individually as opposed to cleaning on Microsoft Excel. The original column is then deleted.
2) Creating a column for the sum of responses for each survey question number that allows multiple responses
Since the survey questionnaire is designed to allow multiple responses, we can make comparisons among people who picked multiple tools. The sum of responses is recorded in a new column (again on excel because Tableau’s limitation of slow loading time). The assumption is that respondents who picked a particular option have used the tool before and are still using it or stop using it but endorse it. We have to assume that despite using a tool, if a person does not like it he would not pick it.
Columns created (all are numerical 0-1 variables): SEARCHTOT, ACCESSTOT, ALERTTOT, READTOT, ANALYZTOT, NOTETOT, WRITETOT, REFTOT, SHAREPUBTOT, DATATOT, JRNLTOT, PUBLTOT, POSTTOT, TELLTOT, RESPROFTOT, PRTOT and IMPACTTOT.
3) Creating a column for each research workflow phase and the grand total number of tools used across the entire survey
This would assist in the comparison of people who use more tools than people who use fewer tools and derive any insights from people who are mor willing to adapt and explore new tools versus those who are more focused on using just a few tools to get the job done.
Assumption: If a respondent has picked the (and also) others tools, it counts as 1 additional tool only.
Columns created: DISCPTOT, COLDATATOT, ANALYSISTOT, WRITTOT, PUBARTOT, OUTRTOT, ASSTOT and CLANGTOT.
4) Finally, a grand total column is created which reflects the number of tools that the user finds useful. This is the basis of majority of the anlysis.
GTOTALTOT column is created.
5) The data is now cleaned and ready to analyze.
Analysis
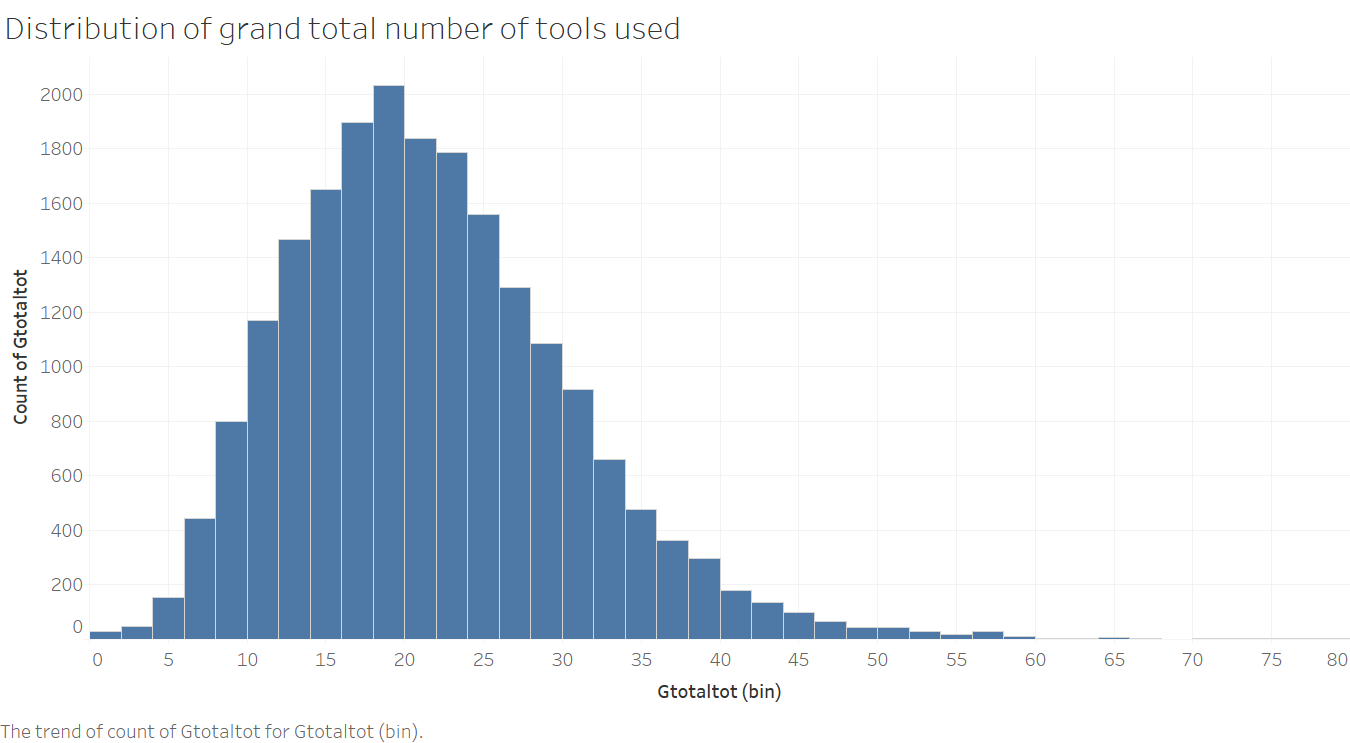
First we analyze the distribution of the tool usage frequency. This is done by creating a dashboard of all the histograms of the total tools used for each of the TOT variable columns created earlier.
From the analysis, we find that a large majority of researchers use:
- 18 to 20 tools in grand total
- 6 to 8 tools for their literature and data collection
- 2 to 4 tools for analysis and writing
- 4 to 6 tools for publishing and archiving
- 2 to 4 tools for outreach
- 0 to 2 tools for assessment
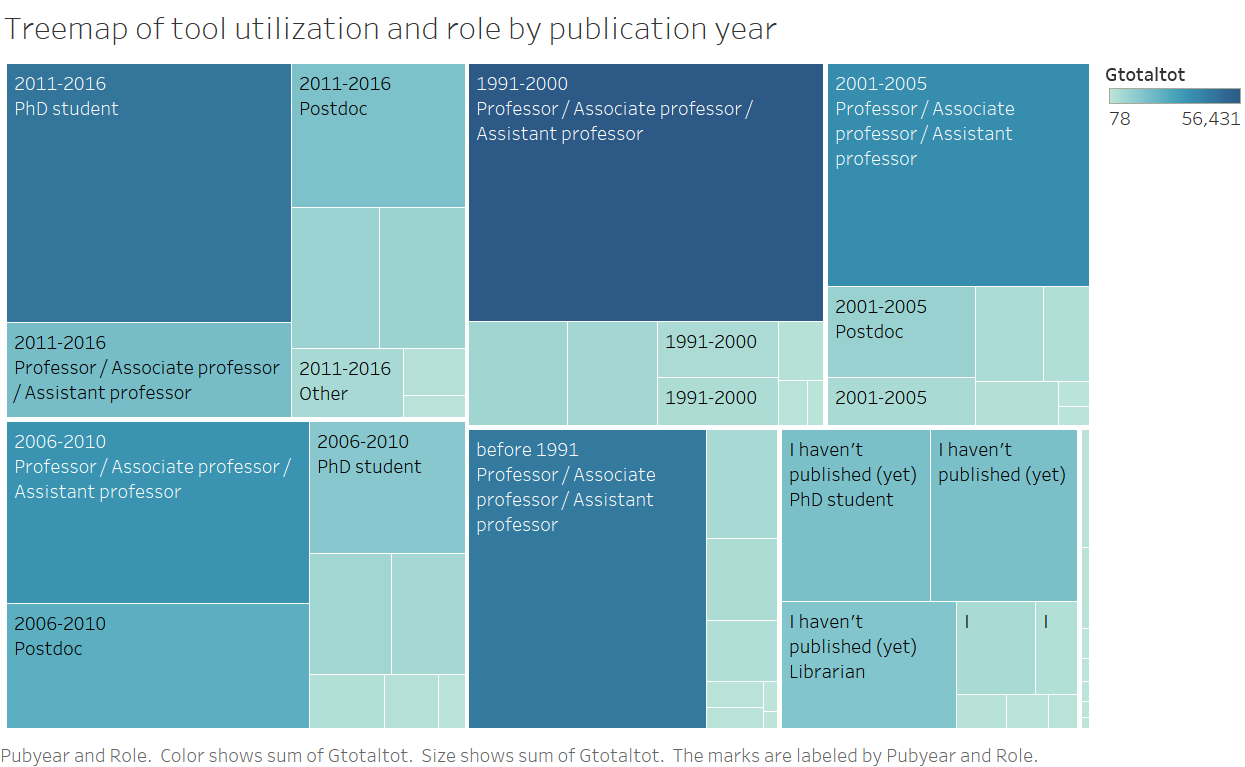
From the treemap, we observe that as the years pass by, PhD students are the ones that are utilizing more tools and publishing their papers, exceeding that of Professors/Associate professors and Assistant professor roles.
Tools Utilized
Tableau 10.0
Microsoft Excel 2016

