Difference between revisions of "IS428 2016-17 Term1 Assign2 Zheng Xiye"
| Line 88: | Line 88: | ||
===Visualization 2=== | ===Visualization 2=== | ||
| − | In order to | + | In order to explore the potential relationship between age group and injury percentage, I have plotted a stacked bars graph with 'Victims Age Group' as column and 'Number of Records' as row. 'Major Industry' is also put as column so as to see age group breakdown within each major industry. On top of which, I have also put Injured (Overtime) as color in seek of examining whether most of the injuries could be traced to exhaustive overtime work. Plotted stacked bars graph as shown below. |
[[File: Victim by Age Group.JPG]] | [[File: Victim by Age Group.JPG]] | ||
Revision as of 22:37, 25 September 2016
Contents
Theme of Interest
Workplace security and safety has always been one of the essential areas of consideration in Singapore when structuring government policies. Singapore government's high concerns over its workforce's physical well-being has not only reassured its people of conducive working environment but also attracted talents from nearby countries to maintain the sustainable growth of Singapore's economy. However, SMRT Track Accident on 22nd March earlier this year, has sparked off another round of discussion centering around the extend of safety measures that should be implemented in Singapore's workplace. Disputes from which went beyond the context of SMRT Operations Safety Protocols to every aspects of measures, necessary in preventing workplace injuries. On top of which, according to WSHI National Statistics Report 2014, although the number of workplace fatal injury cases has decreased from 73 to 60, number of major and minor injuries in 2014 remain as high as 2013 and going on an increasing trend to 672 and 12,863 respectively from 640 and 11,740. From this perspective, exploring potential correlations between various factors and injury rate may be beneficial in structuring preventive and mitigation actions accordingly.
Analytical & Investigation Questions
Questions listed below are potential correlations hoping to be substantiated with concrete data exploration outputs:
- Which major industry did most of the work injuries fall under and what are some of the most prominent accident type within each industry?
- Which age groups are more likely to be injured across all major industries?
- Which days of the week and months of the year are having the highest work injuries rate?
- Which groups of victims with certain characteristics combination are experiencing largest number of work injuries?
Tools
- Tableau Desktop
- JMP Pro 12
- Microsoft Excel
Approaches
Data Preprocessing
1. Data Selection
Out of 48 data variables given, only those relevant to the context of this data exploration process are selected and grouped into 4 distinct data categories based on its nature.
| S/D | Data Categories | Data Variables |
|---|---|---|
| I. | Accident Time Data |
|
| II. | Accident Industry Data |
|
| III. | Accident Type Data |
|
| IV. | Accident Victims Data |
|
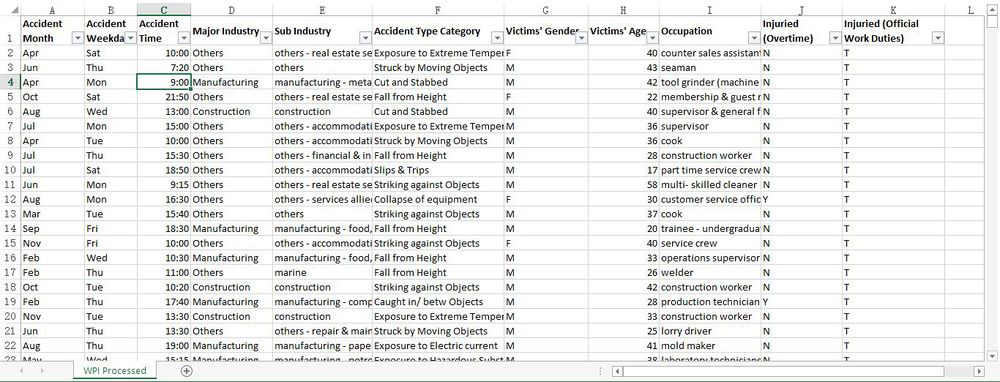
2. Lowercase Formatting - Sub Industry & Occupation
After browsing through the data, I noticed that both Sub Industry and Occupation has data variables of different cases, resulting in 'double-counting' due to duplication. As such, I have made use of JMP Pro's formula: Character - Lowercase to standardize casing of all data variables in both columns. This is achieved by:
- Importing data to JMP Pro and creating a new column - 'Sub Industry LC'.
- Right-click at the top of 'Sub Industry LC' and choose 'formula'.
- In the 'formula' panel, click on 'Character' followed by 'Lower Case' and lastly, 'Sub Industry' as the parameter of 'Lowercase' function.
- The same process is repeated to convert all 'Occupation' data variables to lower case. In the end, output file is exported from JMP to excel file named, 'WPI Processed'.
3. Error Data Modification

During the process of standardizing casing for 'Occupation', I noticed that 'Occupation' contains error data as shown above (e.g. 'cook' is spelled as 'cooker' or 'cooks'). Potential reasons of which could be due to typo error when inputting the data. All data variables with similar spelling are converted to interpreted actual value.
*Data ready to be imported into Tableau
4. Data Categorization
After data has been imported into Tableau, I realized that Victims' age spans across a large range of values in an unorderly manner. In seek of improving ease and clarity of analysis, I have made use of Tableau's 'Create Calculated Field' feature to convert Victims' Age to Victims' Age Group.
- Junior: <=35
- Middle-Aged: >35 & <=60
- Old: >60
Visualization 1
Screenshot shown above is the trends overview for Singapore's workplace injuries in 2014. It indicates that 'Manufacturing sector had the highest overall injury rate followed by Construction sector.' In order to verify the hypothesis, I have prepared a simple treemap indicating the various industries' injury rate (as shown below). It is shown that 'Manufacturing' does indeed constitutes the largest portion (24.3%) of workplace injuries followed by 'Construction' (22.2%).
Building upon which, I have included another dimension: 'Accident Type Category' in seek of exploring major types of accidents resulting in the steadily increasing workplace injury rates. As indicated in the newly generated treemap (as shown below), 'Struck by Moving Objects' and 'Fall from Height' are two most prominent types of accidents taking place across all industries.
Visualization 2
In order to explore the potential relationship between age group and injury percentage, I have plotted a stacked bars graph with 'Victims Age Group' as column and 'Number of Records' as row. 'Major Industry' is also put as column so as to see age group breakdown within each major industry. On top of which, I have also put Injured (Overtime) as color in seek of examining whether most of the injuries could be traced to exhaustive overtime work. Plotted stacked bars graph as shown below.
Conclusion
Reference
WSHI National Statistics Report 2014 SMRT Track Accident
