Difference between revisions of "IS428 2016-17 Term1 Assign1 Bong Jun Hao"
| Line 63: | Line 63: | ||
==Tools Utilized== | ==Tools Utilized== | ||
The following tools were leveraged on for this project: | The following tools were leveraged on for this project: | ||
| − | 1. Microsoft Excel: To store all the raw data and to manipulate and arrange the data sets for easy use in Tableau. | + | 1. Microsoft Excel: To store all the raw data and to manipulate and arrange the data sets for easy use in Tableau.<br /> |
2. Tableau: To generate the chart and provide visualization of the analysis of the data set. | 2. Tableau: To generate the chart and provide visualization of the analysis of the data set. | ||
==Results== | ==Results== | ||
Revision as of 05:56, 29 August 2016
Contents
Abstract
This project aims to look at the private property outlook in Singapore, using data of private properties in 2015 extracted from the URA's REALIS database. It focuses on 2 aspects, the supply of private properties as well as their prices.
Problem and Motivation
With the Population White Paper released in 2013 by the Singapore Government projecting Singapore's population as 6.9 million in 2020, there is an underlying meaning with this projection as it seems to indicate that there would be an influx of foreign talents to support and reach this projected population since our birth rate at 1.25 in 2015 is not enough to replenish our own population; let alone increase it.
The housing policy in Singapore is such that the foreign talents or expats are not allowed to purchase public housing, and as such their choices are limited to that of private properties.This leads to increased competition for private housing in Singapore, as increasingly affluent citizens looking to upgrade from public housing or for investment purposes would also need to vie with non-citizens looking for a roof over their heads. On the other hand, the slowing of growth of expatriates coming into Singapore has also led to fluctuations in demand and supply of private properties, perhaps slightly contributing to a fall of 3.7% in its price in 2015. These fluctuations give rise to a potential opportunity for other potential homeowners to move in, be it for investment or otherwise.
Hence the motivation behind this project lies in exploring the distribution and availability of private properties in Singapore as well as its price levels, so as to help potential buyers in making a decision when it comes to buying private properties. The main variables involved in this would be firstly the number of available private housing and secondly, the pricing of such housing. All these takes in to account the distribution of such housing by types across the different regions in the country.
Approaches
Prior to examining and analyzing the data, the first step would be to collate the data set, and this involves going into the Urban Redevelopment Authority(URA)'s REALIS database to extract data regarding private property in Singapore. I focused solely on the private residential properties in Singapore, choosing to draw out data using the Stock and Transactions tab as they allow me to retrieve information regarding the availability as well as the transaction prices of private properties in 2015.
When using the stock and transactions tab i made use of the data analysis tool in REALIS to make use of filters or variables such as the planning region (Central, East, North East, North, West) which would help when using the Tableau tool to differentiate the private properties distribution and pricing by geographical segmentation.
Data Cleanup
The data retrieved from the REALIS database is not in a format that is suitable for use with the Tableau software for analysis. Difficulties were encountered when trying to use the data in its raw format as there were cases where there were null entries, such as when retrieving the transaction information in 2015 since there were some months where a particular type of private property did not have any sales or change of ownership. In other cases, there is a need to arrange the heading of the data better so that it can be easily manipulated into the rows and columns when using the Tableau software.
As such, there is a need to manually download and manipulate them into a format such that it can be fed into the Tableau software for easier management.

Raw Data for supply of private properties in 2015

Cleaned up data for the supply of private properties in 2015
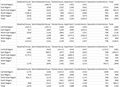
Raw Data for pricing of private properties in 2015

Cleaned up data for the pricing of private properties in 2015


Visualization and Graphing
Share of Private Properties in 2015

Availability of private properties in 2015
Share of private properties by Type in 2015

Distribution of private properties by Region in 2015

Distribution of private properties by Quarter in 2015


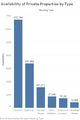
I decided to present the availability of private properties based on the housing type which involves six categories; namely Condominium, Apartment, Detached House, Executive Condominium, Semi-detached house and Terrace house. It is also based on the region so as to present an overview of the supply not only by share based on categories, but also distribution by geographical location.
A bar chart is used for the presentation as the reader would be able to see at a glance if there is any skewed differences in the type or geographical location of the private properties.
As seen in the graphs, the type of housing with the highest availability of supply would be the condominiums, followed by apartments. There were a total of 1,366,584 private properties available in 2015, and the condominiums and apartments alone make up 74% of the total private properties supply.
It can also be noted that the availability of private properties lies mainly in the central region, making up about 50% of the total supply in 2015.
The last pattern that can been observed would be that of the availability based on time, where throughout all 4 quarters the supply of private properties were relatively stable with no strong increases or cuts.
Distribution of Private Properties Pricing in 2015
Median Price of private properties in 2015
Median Price PSF in 2015


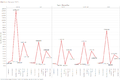
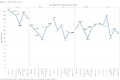
As for the pricing of the transactions of private properties in 2015, i decided to present it using a line chart format as it straight away enables the reader to look at the fluctuations in pricing. The charts are based not only on the geographical locations, but also by the housing type so that the user are able look at the key differences and compare across different housing types or even regions at a glance.
A Median Price Per Square Feet distribution is also used so as to have a more accurate representation based on the sizing of each individual private property rather then other factors which would have been difficult to pin point.
It can be observed that both average median prices and prices per square feet is the highest for private properties within the Central Region.
It can also be observed that despite detached houses being bigger in size and considered as a much more premium form of housing, its average PSF price in 2015 is not the highest even though its average transaction price might be the highest, most probably attributed to its larger sizes. Apartments and condominiums tend to have higher average price PSF across Singapore.
Lastly, correlating this with the supply of private properties in Singapore, it can been seen that in regions like Central where the supply of private properties is much higher as compared to that of regions such as the north region, the higher supply does not necessarily results in lower prices, suggesting that there is a relatively strong demand of private properties especially in the Central region.
Tools Utilized
The following tools were leveraged on for this project:
1. Microsoft Excel: To store all the raw data and to manipulate and arrange the data sets for easy use in Tableau.
2. Tableau: To generate the chart and provide visualization of the analysis of the data set.